 Web Server Statistics for nrrr.ca Web Server Statistics for nrrr.ca
(Go To: Top: General Summary: Daily Summary: Hourly Summary: Domain Report: Organization Report: Operating System Report: Status Code Report: File Size Report: File Type Report: Directory Report: Request Report)
This report contains overall statistics.
Successful requests: 3,908
Average successful requests per day: 3,912
Successful requests for pages: 3,289
Average successful requests for pages per day: 3,292
Failed requests: 1,496
Redirected requests: 11
Distinct files requested: 284
Distinct hosts served: 341
Corrupt logfile lines: 63
Data transferred: 1.03 gigabytes
Average data transferred per day: 1.03 gigabytes
(Go To: Top: General Summary: Daily Summary: Hourly Summary: Domain Report: Organization Report: Operating System Report: Status Code Report: File Size Report: File Type Report: Directory Report: Request Report)
This report lists the total activity for each day of the week, summed over all the weeks in the report.
Each unit ( ) represents 80 requests
for pages or part thereof.
) represents 80 requests
for pages or part thereof.
day: #reqs: #pages: ---: -----: ------: Sun: 0: 0: Mon: 3908: 3289:Tue: 0: 0: Wed: 0: 0: Thu: 0: 0: Fri: 0: 0: Sat: 0: 0:
(Go To: Top: General Summary: Daily Summary: Hourly Summary: Domain Report: Organization Report: Operating System Report: Status Code Report: File Size Report: File Type Report: Directory Report: Request Report)
This report lists the total activity for each hour of the day, summed over all the days in the report.
Each unit () represents 6 requests
for pages or part thereof.
hour: #reqs: #pages: ----: -----: ------: 0: 227: 203:3: 216: 190:
4: 239: 215:
5: 245: 210:
13: 114: 92:
(Go To: Top: General Summary: Daily Summary: Hourly Summary: Domain Report: Organization Report: Operating System Report: Status Code Report: File Size Report: File Type Report: Directory Report: Request Report)
This report lists the countries of the computers which requested files.
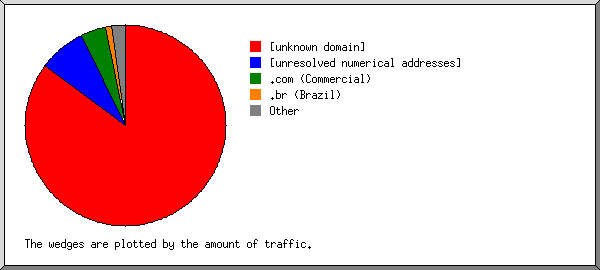
Listing domains, sorted by the amount of traffic.
#reqs: %bytes: domain
-----: ------: ------
 2027: 87.00%: .ru (Russia)
 1586:  7.04%: [unresolved numerical addresses]
  171:  3.04%: .com (Commercial)
   56:  1.58%: [unknown domain]
   24:  0.73%: .net (Networks)
   12:  0.41%: .nl (Netherlands)
    2:  0.07%: .hu (Hungary)
    4:  0.06%: .de (Germany)
    1:  0.06%: [domain not given]
    1:  0.01%: .ca (Canada)
    4:       : .ar (Argentina)
    5:       : .vn (Vietnam)
    6:       : .br (Brazil)
    1:       : .co (Colombia)
    1:       : .arpa (Arpanet)
    2:       : .mx (Mexico)
    1:       : .ua (Ukraine)
    1:       : .ec (Ecuador)
    1:       : .tr (Turkey)
    1:       : .ae (United Arab Emirates)
    1:       : .by (Belarus)
(Go To: Top: General Summary: Daily Summary: Hourly Summary: Domain Report: Organization Report: Operating System Report: Status Code Report: File Size Report: File Type Report: Directory Report: Request Report)
This report lists the organizations of the computers which requested files.
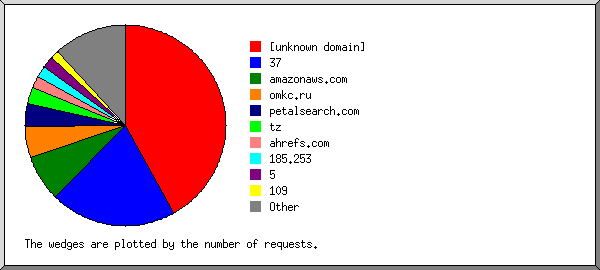
Listing the top 20 organizations by the number of requests, sorted by the number of requests.
#reqs: %bytes: organization
-----: ------: ------------
 2027: 87.00%: ertelecom.ru
 1344:  1.24%: 77
   77:  0.79%: petalsearch.com
   56:  1.58%: [unknown domain]
   34:  0.24%: 216.244
   22:  0.79%: 31
   21:  0.71%: colocrossing.com
   18:  0.37%: semrush.com
   15:  0.01%: 43
   15:  0.36%: 46
   12:  0.41%: easynet.nl
   11:  0.10%: ahrefs.net
   10:  0.64%: cloudzy.com
   10:  0.13%: 194.150
    8:  0.43%: 82
    7:  0.01%: hwclouds-dns.com
    6:  0.12%: 85
    6:  0.39%: ip-158-69-22.net
    5:  0.07%: 185.255
    5:  0.07%: 84
  199:  4.54%: [not listed: 119 organizations]
(Go To: Top: General Summary: Daily Summary: Hourly Summary: Domain Report: Organization Report: Operating System Report: Status Code Report: File Size Report: File Type Report: Directory Report: Request Report)
This report lists the operating systems used by visitors.
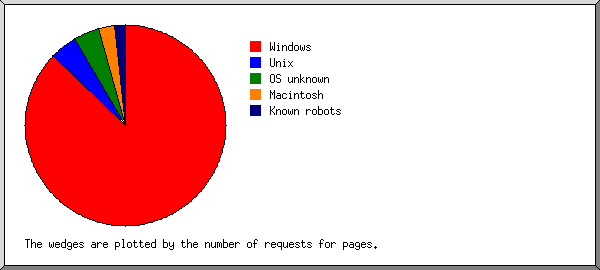
Listing operating systems, sorted by the number of requests for pages.
 #: #reqs: #pages: OS
--: -----: ------: --
 1:  3472:   2981: Windows
  :  3471:   2980:   Windows NT
  :     1:      1:   Unknown Windows
 2:   231:    181: OS unknown
 3:    97:     72: Macintosh
 4:    89:     44: Unix
  :    88:     43:   Linux
  :     1:      1:   Other Unix
 5:    19:     11: Known robots
(Go To: Top: General Summary: Daily Summary: Hourly Summary: Domain Report: Organization Report: Operating System Report: Status Code Report: File Size Report: File Type Report: Directory Report: Request Report)
This report lists the HTTP status codes of all requests.
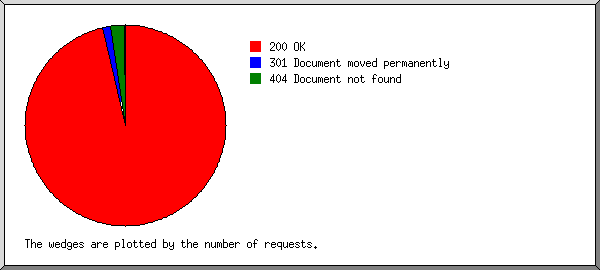
Listing status codes, sorted numerically.
#reqs: status code
-----: -----------
 3899: 200 OK
    2: 206 Partial content
   11: 301 Document moved permanently
    7: 304 Not modified since last retrieval
    1: 403 Access forbidden
 1495: 404 Document not found
(Go To: Top: General Summary: Daily Summary: Hourly Summary: Domain Report: Organization Report: Operating System Report: Status Code Report: File Size Report: File Type Report: Directory Report: Request Report)
This report lists the sizes of files.
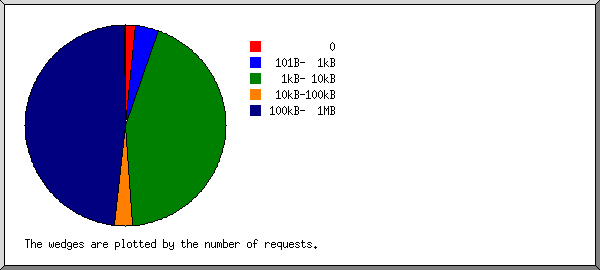
       size: #reqs: %bytes:
-----------: -----: ------:
          0:    11:       :
   1B-  10B:     0:       :
  11B- 100B:     1:       :
 101B-  1kB:   540:  0.02%:
  1kB- 10kB:   404:  0.15%:
 10kB-100kB:  1397:  1.40%:
100kB-  1MB:  1554: 98.31%:
  1MB- 10MB:     1:  0.12%:
(Go To: Top: General Summary: Daily Summary: Hourly Summary: Domain Report: Organization Report: Operating System Report: Status Code Report: File Size Report: File Type Report: Directory Report: Request Report)
This report lists the extensions of files.
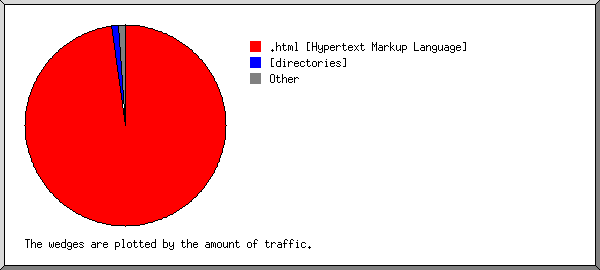
Listing extensions with at least 0.1% of the traffic, sorted by the amount of traffic.
#reqs: %bytes: extension
-----: ------: ---------
 1554: 97.60%: .html [Hypertext Markup Language]
 1696:  1.30%: [directories]
  292:  0.23%: .php  [PHP]
  259:  0.18%: .png  [PNG graphics]
   27:  0.18%: .jpg  [JPEG graphics]
    7:  0.13%: .js   [JavaScript code]
    1:  0.12%: .JPG
   72:  0.26%: [not listed: 8 extensions]
(Go To: Top: General Summary: Daily Summary: Hourly Summary: Domain Report: Organization Report: Operating System Report: Status Code Report: File Size Report: File Type Report: Directory Report: Request Report)
This report lists the directories from which files were requested. (The figures for each directory include all of its subdirectories.)
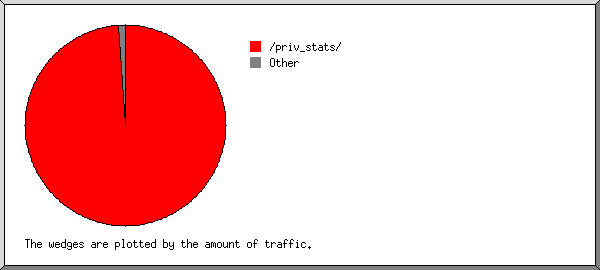
Listing directories with at least 0.01% of the traffic, sorted by the amount of traffic.
#reqs: %bytes: directory
-----: ------: ---------
 2885: 98.85%: /priv_stats/
  497:  0.19%: /assets/
   22:  0.17%: /justin/
   50:  0.15%: [root directory]
   49:  0.15%: /biol595/
    6:  0.10%: /alorch/
   26:  0.10%: /adam-lorch/
  242:  0.08%: /vanworm/
    5:  0.07%: /pool/
    9:  0.05%: /advanc/
    5:  0.04%: /Portfolio/
   62:  0.03%: http://
    2:  0.01%: /pool24/
   48:  0.03%: [not listed: 15 directories]
(Go To: Top: General Summary: Daily Summary: Hourly Summary: Domain Report: Organization Report: Operating System Report: Status Code Report: File Size Report: File Type Report: Directory Report: Request Report)
This report lists the files on the site.
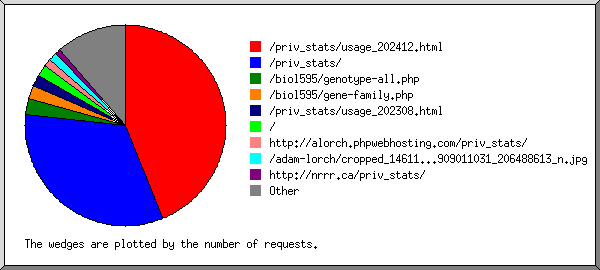
Listing files with at least 20 requests, sorted by the number of requests.
#reqs: %bytes:          last time: file
-----: ------: ------------------: ----
 1414: 91.09%: Jul/20/26 11:58 PM: /priv_stats/usage_202607.html
 1348:  1.25%: Jul/20/26 11:43 PM: /priv_stats/
  243:  0.01%: Jul/20/26 11:58 PM: /assets/connections/checkerboard.png
  228:  0.08%: Jul/20/26 11:58 PM: /vanworm/signup.php
  224:  0.01%: Jul/20/26 11:58 PM: /assets/cards/favorite-author/
   36:  0.02%: Jul/20/26 10:46 PM: /
   29:  0.08%: Jul/20/26 11:45 PM: /biol595/gene-family.php
   21:  1.12%: Jul/20/26 11:19 PM: /priv_stats/usage_202202.html
  365:  6.35%: Jul/20/26 11:58 PM: [not listed: 229 files]
(Go To: Top: General Summary: Daily Summary: Hourly Summary: Domain Report: Organization Report: Operating System Report: Status Code Report: File Size Report: File Type Report: Directory Report: Request Report)
